A fascinating example of a binary tropical cyclone interaction occured in the East Pacific during September 2001 between Gil and Henriette. Although Gil reached hurricane-strength and Henriette reached tropical-storm-strength at their peak intensities, the final stages of the interaction occured when both were only low-level circulations. However, as time evolved from the onset of interaction, the two storms changed size, location, and strength; therefore also changing their size ratio, separation distance, vorticity ratio, and circulation ratio (all parameters that are shown to be critical to classifying what type of interaction will occur).
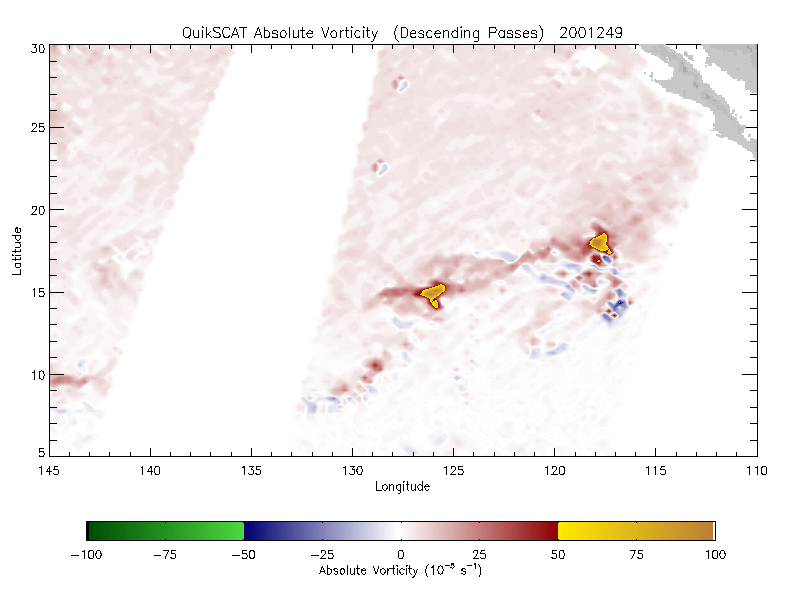
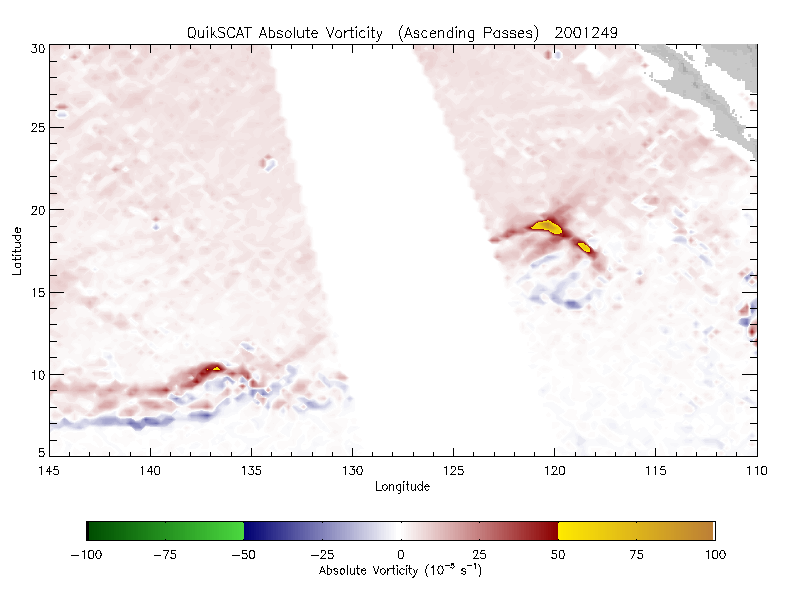
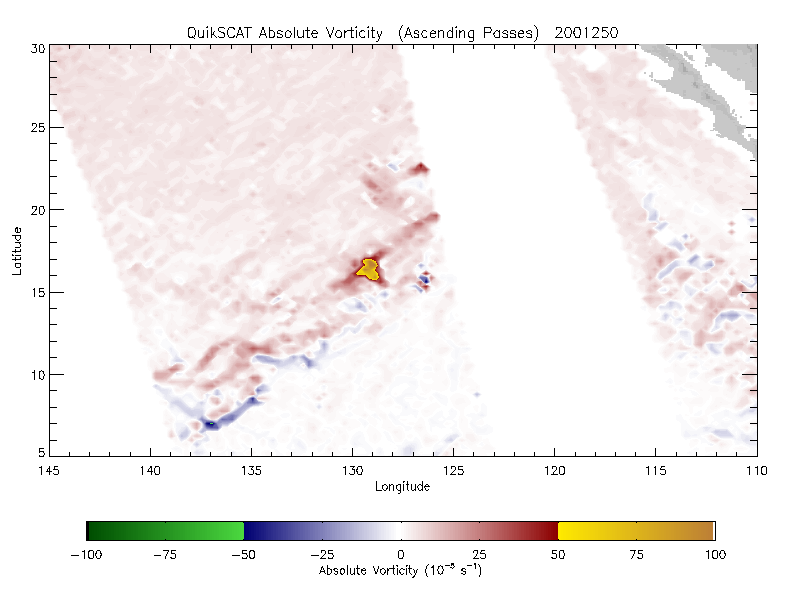
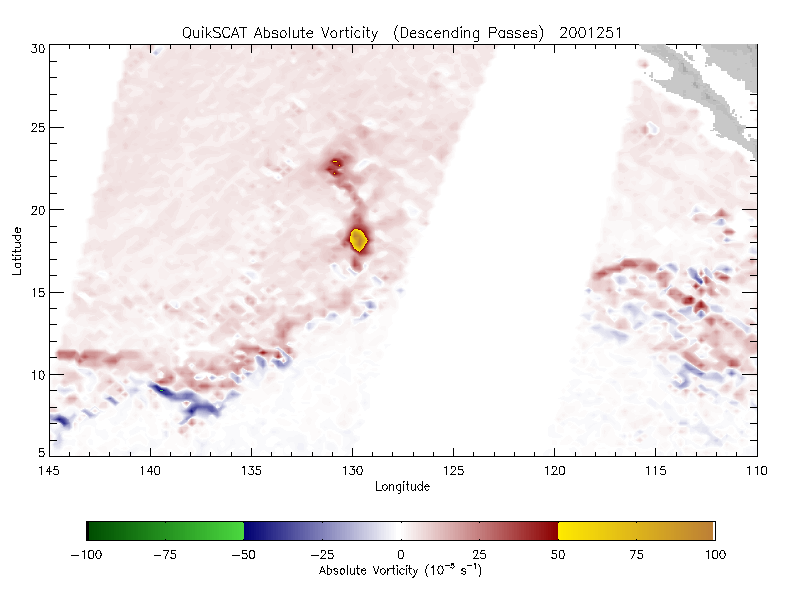
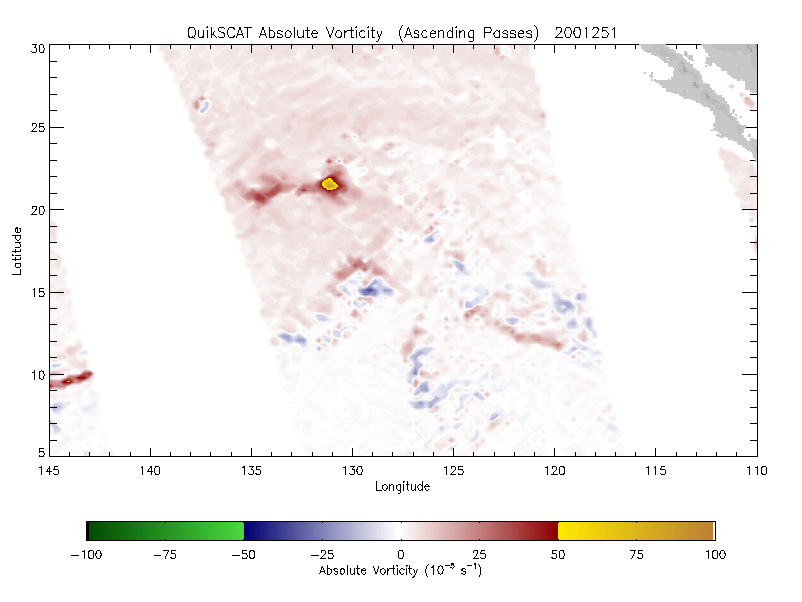
The chart below outlines the various parameters beginning at the approximate onset time of apparent interaction, and ending when 34 kt wind radii are no longer available from NHC Advisories. The radii shown are the 34 kt wind radii from NHC Advisories, the vorticity values are derived from QuikSCAT winds, and so the circulation ratios (C=ζπR²) are a combination of NHC and QuikSCAT data.
| RGIL | RHEN | d | Δ | Δ/RGIL | RHEN/RGIL | ζGIL | ζHEN | ζHEN/ζGIL | CHEN/CGIL | |
| 06 SEP, 03 UTC | 140 | 223 | 930 | 567 | 4.05 | 1.59 | 100 | 110 | 1.10 | 2.78 |
| 06 SEP, 09 UTC | 167 | 209 | 889 | 513 | 3.07 | 1.25 | - | - | - | - |
| 06 SEP, 15 UTC | 186 | 209 | 858 | 463 | 2.49 | 1.12 | - | 90 | - | - |
| 06 SEP, 21 UTC | 186 | 279 | 871 | 406 | 2.18 | 1.50 | - | - | - | - |
| 07 SEP, 03 UTC | 244 | 286 | 851 | 321 | 1.32 | 1.17 | - | - | - | - |
| 07 SEP, 09 UTC | 244 | 286 | 767 | 237 | 0.97 | 1.17 | - | - | - | - |
| 07 SEP, 15 UTC | 302 | 181 | 778 | 295 | 0.98 | 0.60 | 110 | - | - | - |
| 07 SEP, 21 UTC | 177 | 84 | 651 | 390 | 2.20 | 0.47 | - | - | - | - |
| 08 SEP, 03 UTC | 186 | 74 | 587 | 327 | 1.76 | 0.40 | 100 | 55 | 0.55 | 0.09 |
| 08 SEP, 09 UTC | 167 | 56 | 442 | 219 | 1.31 | 0.34 | - | - | - | - |
| 08 SEP, 15 UTC | 349 | - | 408 | - | - | - | 87 | 40 | 0.46 | - |
| 08 SEP, 21 UTC | 279 | - | 347 | - | - | - | - | - | - | - |
Links to four full days of visible imagery over the interaction event can be found below. Each animation is comprised of 42 frames, and is approximately 13 Mb. Each frame is 1248x452 pixels, so be aware that a portion of the image may be off your screen and you will need to scroll over to see it. The same sector was used for all four days to maintain continuity, and 5° latitude and longitude gridlines have been placed on the images. Although the original resolution of the GOES-10 visible images was roughly 1x1 km, it has been degraded to 4x4 km to make the images small enough for easy web viewing and downloading. The timestamp in the upper-left corner of each of the frames can be interpreted using an example as follows: 2001249171513 corresponds to Year 2001, Julian Day 249 (6 Sep), and UTC Time 171513 (HHMMSS). A synopsis of what occurs in each loop is provided below the images.